Charts for your online business (e-commerce)
I’ve created some starter e-commerce analytics charts for companies who sell online.
In one of my previous businesses, I worked with a number of e-commerce companies (or just companies who do some part of their sales online). Usually, I helped them:
- Understand their online sales;
- Increase revenue by identifying the channels that made them the most money;
- Reduced costs by identifying the channels that lost them money;
- Packaged the data in such a way that it was usable by senior management.
However, I know many businesses are just getting started in online sales, so I’ve created a sample e-commerce analytics file with some charts to get you started.
What are the charts for?


The charts visually answer a number of questions:
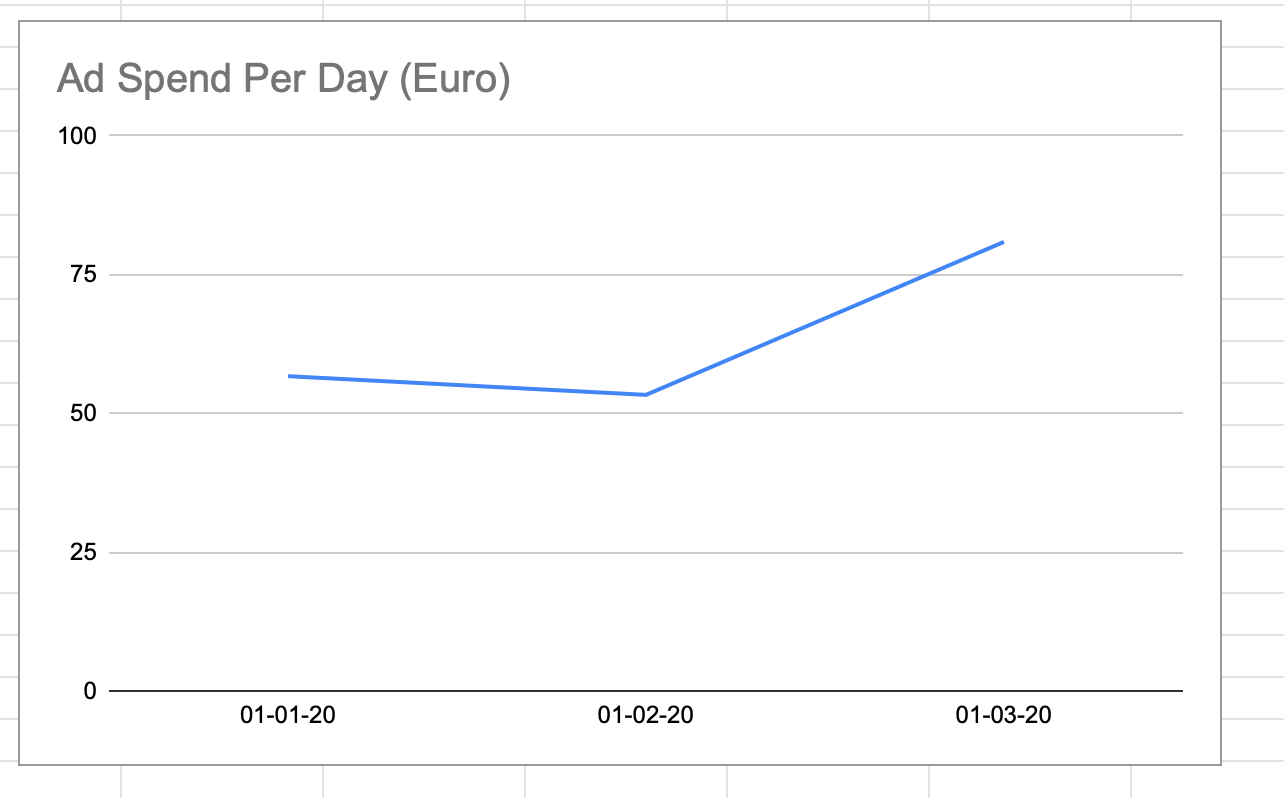
- How much am I spending on ads every day?
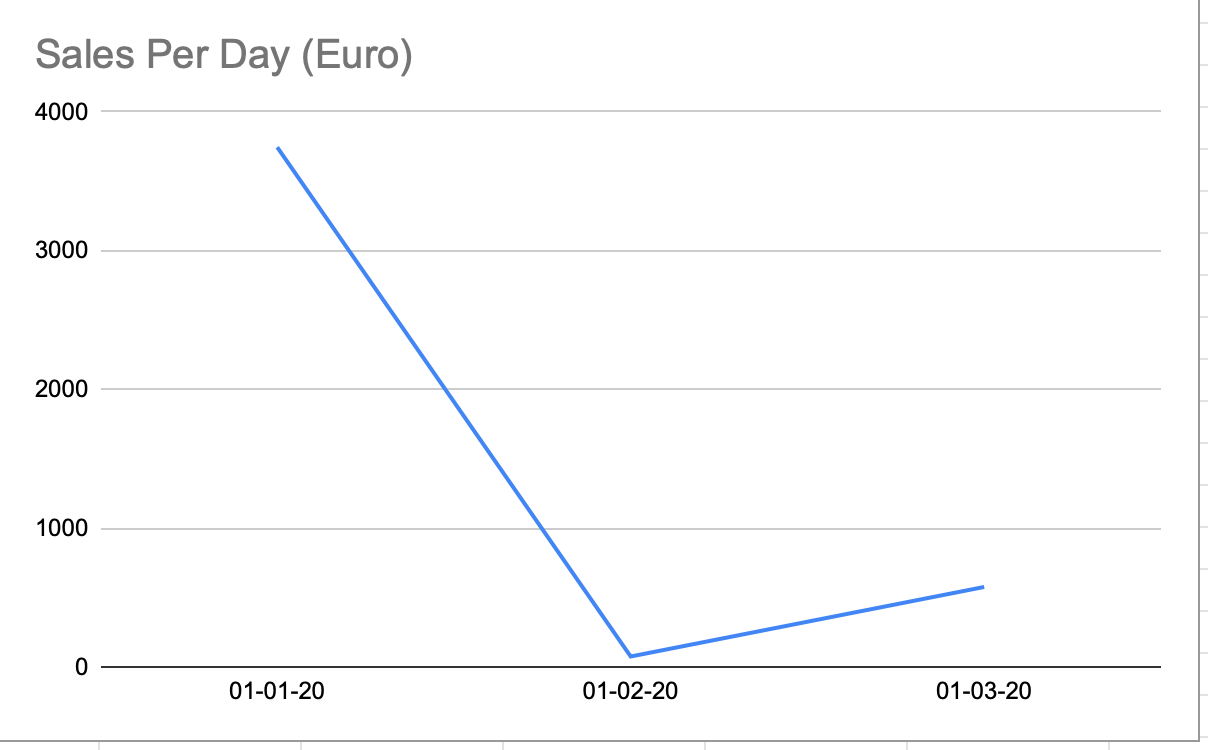
- What are my daily sales?
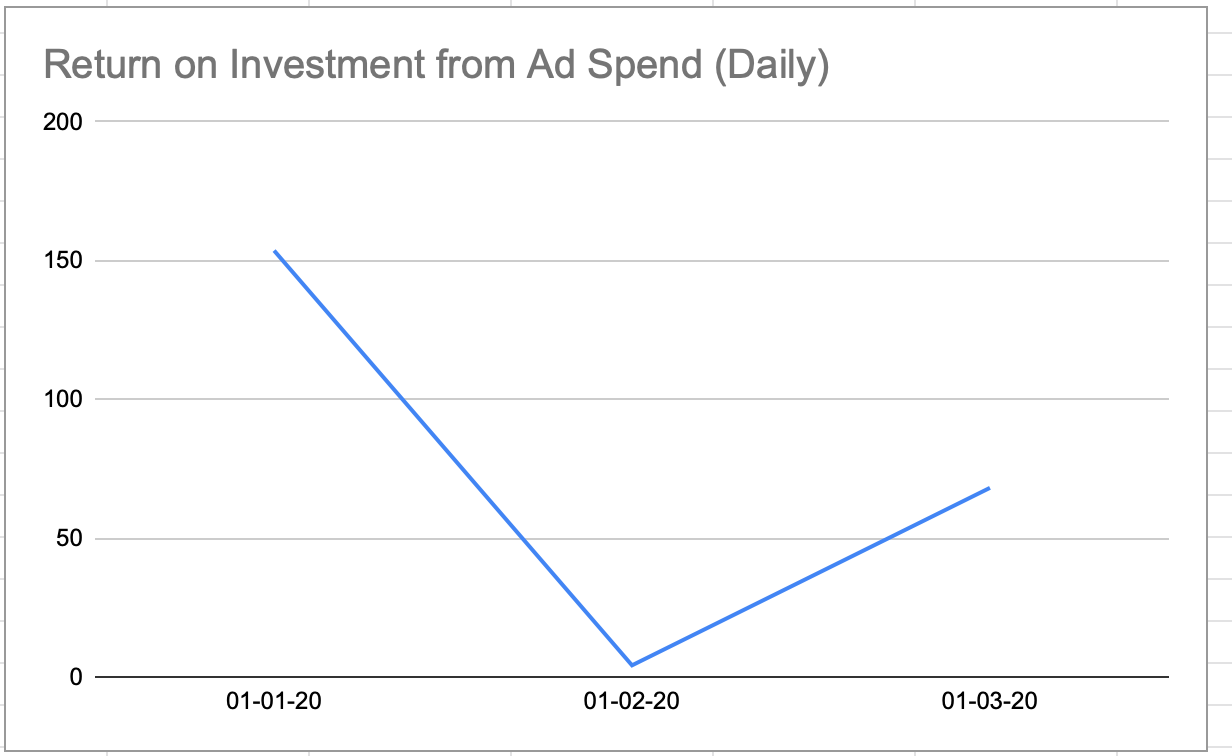
- What is my return on Ad spend overall?
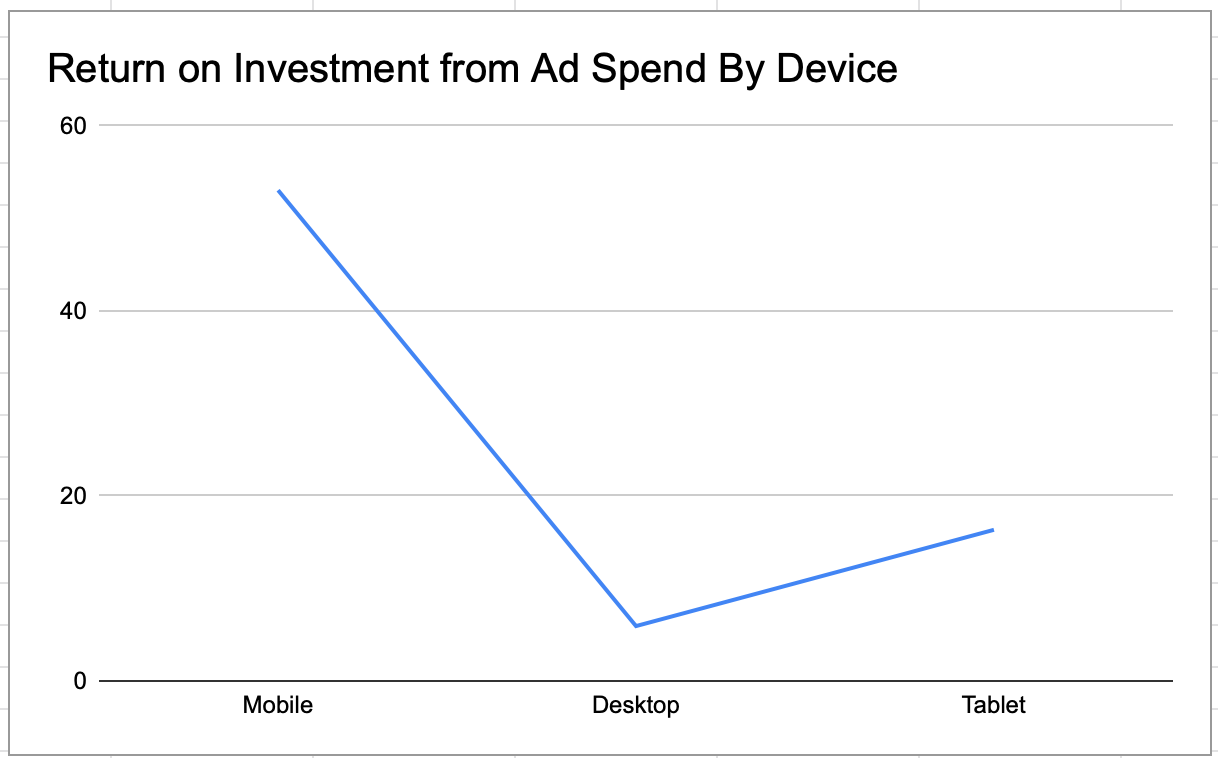
- What is my return on Ad spend for different devices?
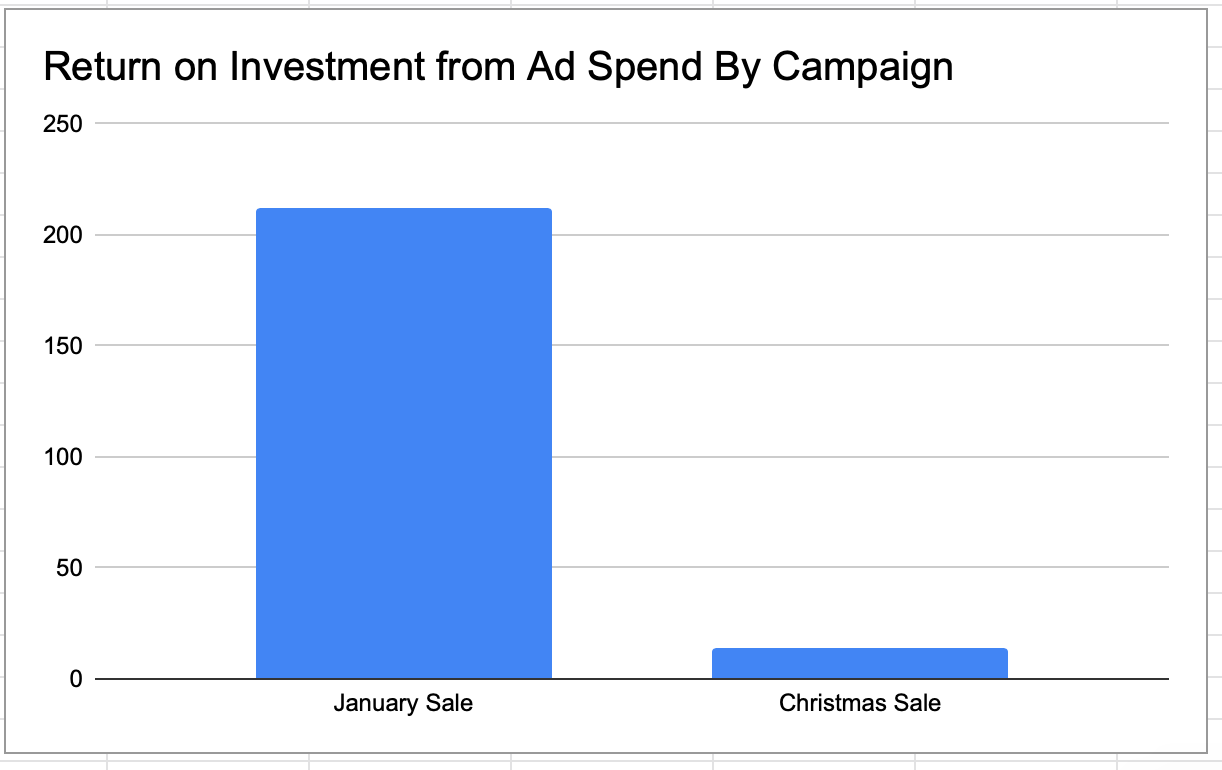
- What is my return on Ad spend for different marketing campaigns?
- What is my daily site conversion rate?
You can view and download the file here.
Why these questions?
There are 100’s of ways to view and analyse your company and how you sell things online. I’ve focused on a few key questions here. There are many other questions that can be answered, and it can (and does) get more complicated than this but if you’re new to measuring your marketing spend, these are an excellent start:
- How much do I spend every day on ads?
- What is my return on investment for the money I spend on ads - i.e. for every $1 I spend on ads, how much do I make in sales? Does this differ by channel - is Google better than Facebook or vice versa?
- How do the different ad campaigns I have perform? Is one better than the other(s)? Again, does this differ by channel?
- I advertise on mobile, desktop and tablets. Do they all perform the same? Are they all worth advertising on?
- What’s the conversion rate on my site - i.e. for every 100 people that visit my site, how many buy something/sign up for my product or service?
What sort of Data is needed to make these charts and where can I get it?
The data should come from two places, the platform you’re advertising on (Facebook ads, Google Ads) and your own site analytics (using Google Analytics for example). There is a little setup required for this, so get in touch if you need help - I’ve done it for many companies. Most platforms allow you to download the data you need as a spreadsheet. You can also extract it via the API - which is preferable for larger data sets. I've done both, but the API provides more detailed data, so I prefer that. However, you'll need an engineer to develop that for you.
The data you need is the following:
- Day - the day of the ad spend/sales - your ad platform and your site analytics dates should match.
- Device - Broadly, this should be desktop, tablet and mobile. Ideally, your ad platform and your site analytics device names should match exactly. However, some platforms use different terms (Facebook might use the term mobile while Google might use 'mobile device', for example) so you may need to check on this first.
- Campaign - You may only have one ad campaign, in which case, this isn’t as important, but if you have multiple campaigns - say you want to compare your January 18-24 Year-olds Campaign to your January 25-30 Year-olds Campaign - then you need to set up separate campaigns and then set up your links correctly so so that your site analytics can properly identify where customers are coming from.
- Impressions - from your ad platform - how many people saw your ad.
- Clicks - from your ad platform - how many people clicked on your ad and visited your site.
- Ad_Spend - from your ad platform - how much money you spent (by day, device and campaign if possible).
- Website_Visits - from your site analytics - how many people clicked on your ad and visited your site (by day, device and campaign if possible).
- Product_Page - from your site analytics - how many people from the group above (Website_Visits) got to your product page to view a product (or another page of your choosing).
- Add_To_Cart - from your site analytics - how many people from the group above (Product_Page) added something to their shopping cart.
- Purchases - from your site analytics - how many people from the group above (Add_To_Cart) actually purchased something.
- Sales - from your site analytics - was anything returned, or did a credit card fail? Or someone cancelled a purchase? This data can also come from your internal systems.
- ROI - this is a calculation of sales/ad_spend. If you spend $2 on ads and make $4 in sales from those ads, your ROI is 2, and so on.
- Conversion_rate - this is a calculation of website_visitors/purchasers. If 100 people visit your site and 4 people make a purchase (or do some other goal on your site), that’s a 4% conversion rate. There are other ways of calculating your conversion rate but this is decent general metric to get you started, if you’ve never done it before.
I've used all the above metrics in the creation of these charts.
How could I extend the charts?
- Move the data from an excel sheet into a database like MYSQL, or something like Google Sheets.
- Connect a visualistation tool like Tableau to make creating the charts easier.
I've done all of the above for a number of companies. My advice is to start small, add your data to the file I've created, and see if that's enough for you. If you need to add more functionality, data or anything else, don't do that until you actually need it.
So that’s some basic e-commerce metrics for you in a nutshell. Feel free to use the charts above for your own company (add your own data) and if you need a little help getting with that, just get in touch!